Developer Tools
Sable includes a set of developer-facing tools accessible in Settings → Developer Tools.
Debug Log Viewer
The debug log viewer shows a live stream of internal application events, useful when diagnosing issues or reporting bugs.
Log categories:
| Category | What it covers |
|---|---|
| sync | Sync lifecycle, connection state, room data |
| network | HTTP requests and responses |
| notification | Push and in-app notification events |
| message | Message sends, edits, and uploads |
| call | Voice and video call signaling |
| ui | Component mount/unmount, scroll events |
| timeline | Timeline load, pagination, and reset events |
| general | Miscellaneous application events |
| error | Errors and exceptions |
Controls:
- Filter by category and log level (debug / info / warn / error / fatal)
- Search across all log entries
- Copy log entries to the clipboard
- Export a filtered log file to share when reporting a bug
- Clear the log history
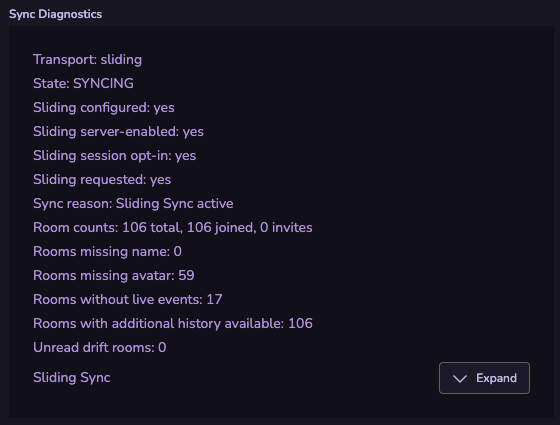
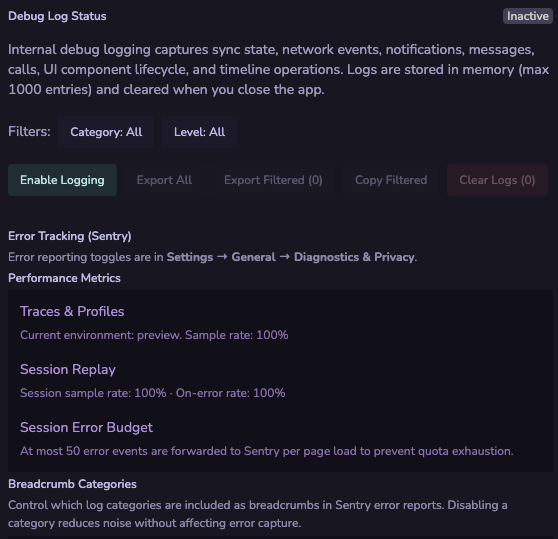
Note: Logs are cleared when a new session starts. They are stored in memory only and are never sent anywhere unless you explicitly export or attach them to a bug report.
Error Tracking (Sentry)
If crash reporting is enabled on your deployment, the developer tools panel also shows:
- Current Sentry status and sample rates
- Toggles for individual breadcrumb categories
- Live error and warning counters
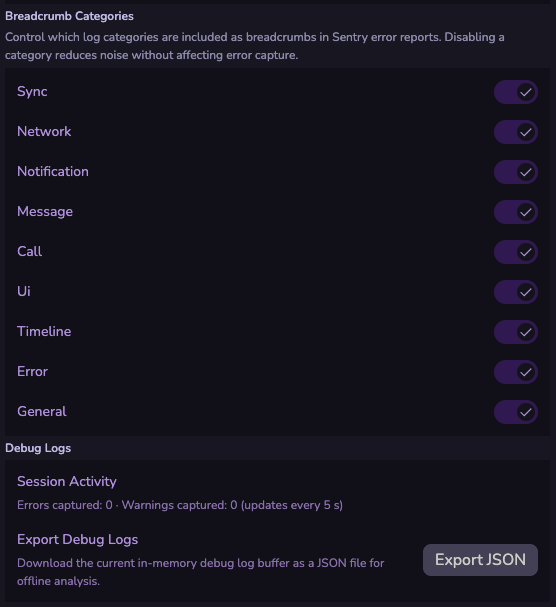
See Privacy & Crash Reporting for information on enabling or disabling crash reporting.
In-App Bug Report
Type /bugreport in any room's compose box to open the bug report form. This prefills a GitHub issue template with your description and optionally attaches your recent debug log export.
Features & Experiments
The Features & Experiments panel (Settings → Developer Tools → Features & Experiments) shows
the feature flags and A/B experiments defined in your deployment's config.json.
For each configured experiment you can see:
- Enabled — whether the experiment is active for any users
- Rollout — the percentage of users enrolled
- Your Variant — the variant you have been assigned, and whether you are in the experiment group or the control group
This is useful for verifying that a flag was deployed correctly, or for confirming which arm of an experiment you are currently in. Variant assignment is deterministic: the same account always receives the same variant for a given experiment key, across devices and sessions.
See Installation → Feature flag and experiment configuration for how operators define experiments.